Consistency in Google Trends: How results can vary across IP addresses

Journalists, researchers, and everyday users often rely on search trend tools to explore how interest in a topic changes over time. But while these tools can prove handy for spotting broad patterns, they can easily be misunderstood, too.
As part of ExpressVPN’s mission, we aim to help users better understand how digital tools and online systems work in practice. We believe that trend tools can offer a useful perspective when they are read with a clear understanding of how they work.
Google Trends uses a sample rather than the full dataset to allow for quick processing while still covering the billions of searches conducted daily. This means that the scores it shows aren’t calculated based on absolute search volume. Instead, as Google explains, the tool displays relative interest based on an anonymized, categorized, and aggregated sample of actual search requests.
Because of this, small differences can appear depending on how and when trend data is viewed. So, we ran a study using Google Trends scores to see how much variance was displayed based on different parameters.
Our observations apply only to the specific sample and timeframe included in this study, and we don't recommend extrapolating the results to broader conclusions about global data consistency.
Research overview: What did we do?
Our team at ExpressVPN analyzed the scores of 102 Google Trends terms and topics spanning two periods: 1 year and 5 years. We ran a controlled comparison of results across multiple VPN locations, devices, and time ranges.
We first studied the smaller time-range sample to find a baseline for potential variation among more recent search results. We then review trends over the 5-year period to see whether temporary fluctuations affected the results of the baseline study. Using this method, we observed current score variances and identified patterns in our dataset.
To keep the study as neutral and repeatable as possible, we used queries from Google Year in Search (YiS), which is Google’s yearly roundup of trending searches. Since categories used in YiS change each year, we combined all categories that appeared between 2020 and 2025 into one list of possible queries.
We distilled the sample to only non-sensitive terms and topics (neutral, non-political, and unlikely to trigger censorship or regional filtering), then randomly selected 100 queries from the remaining list. This helped us ensure cross-country comparability and minimize language and sociocultural bias.
Lastly, our team added two industry-related queries, "VPN" and "Antivirus," bringing the total to 102.
Our goal was to study how Google Trends scores may change across locations and time periods, not to compare the categories themselves. Because of that, we don’t expect differences in category size to meaningfully affect our dataset.
Why analyze terms and topics?
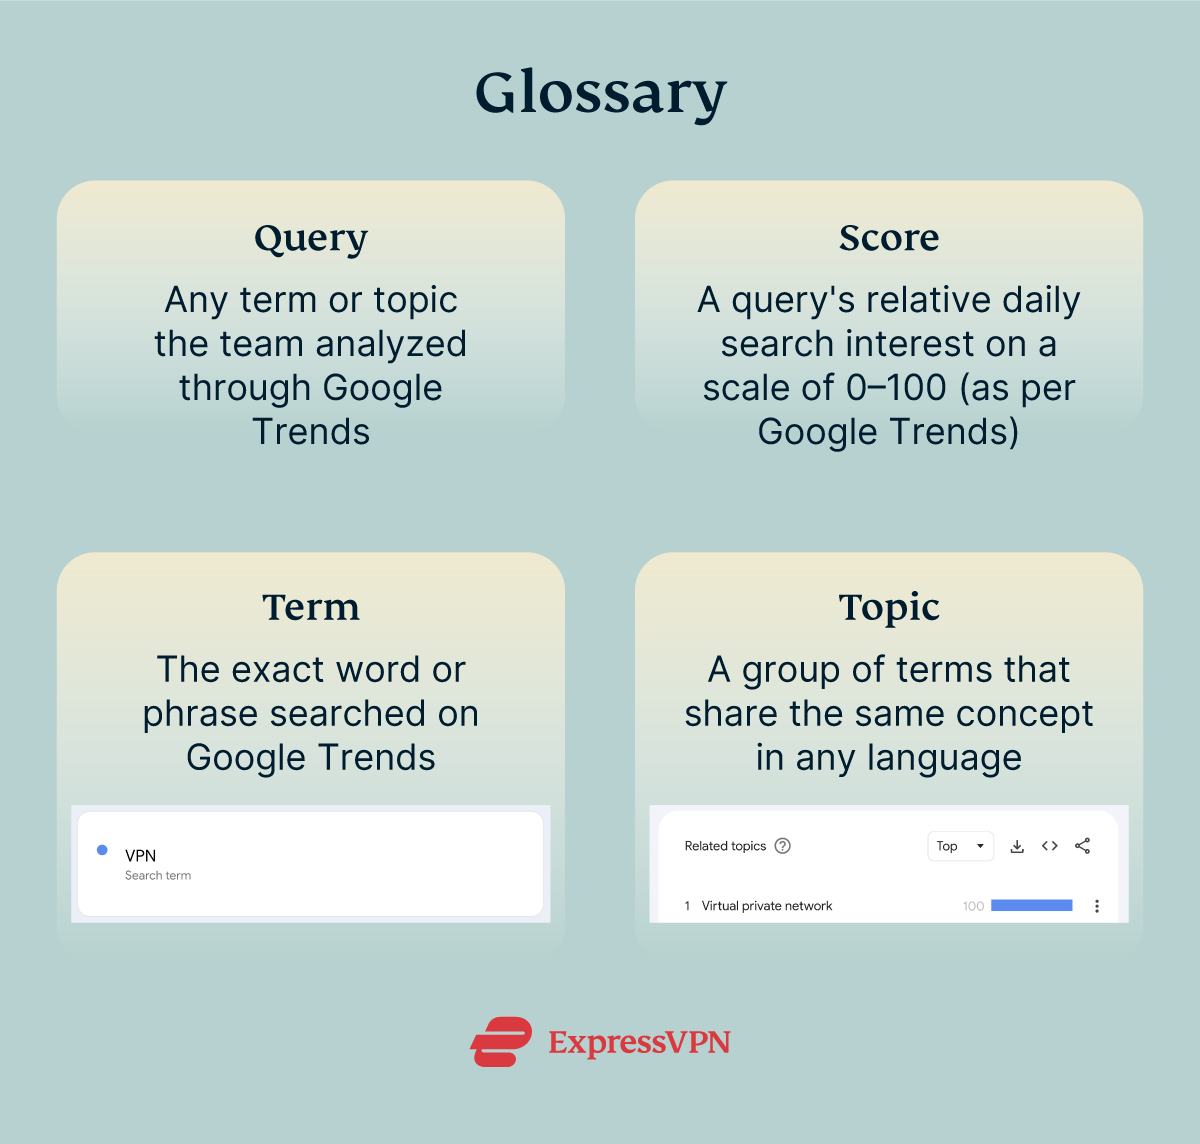
Google Trends defines topics as "a group of terms that share the same concept in any language." We included both term and topic in our study to ensure that the language in which the query was made didn’t impact the results.
Each query pairs a search term with its matching Google Trends topic, so each run captures scores for both. The topic for each query is the top suggestion Google Trends provides for the related term, so both the term and topic refer to the same core subject.
In all iterations of our initial study, the query location was set to "worldwide" on Google Trends. The only variable we changed per query? The VPN location from where the search was made.
We used ExpressVPN to gather data from IP addresses in the three countries with the highest Google traffic worldwide: the U.S., Japan, and India.
Findings and observations: What did the results show?
Although this study is limited in size and scope, we found that queries made through different IP addresses returned varying results.
During testing of the initial dataset (one year), we found that the results for each query matched perfectly across all 3 countries 39.9% of the time. Terms had a 47.0% match rate, while topics had 32.8%, despite topics having a broader scope of interest (as they consider related concepts in multiple languages).
Meanwhile, the longer study coverage (five years) seemed to have smoothed out minor variations, as the match rate for both query types increased by around 21 percentage points (terms went up to 66.9%, while topics went up to 55.4%).
Projecting trends over longer periods seems to provide less variable worldwide trend scores, no matter where the search is coming from. That said, mismatches still appeared in a notable share of results in the 5-year study.
We also conducted sub-studies to confirm whether the magnitude of variation or imputation differences affected our findings. The results are as follows:
- Magnitude and tolerance level: Even when small variations (scores that differed by no more than one point) were counted as matches, at least 1 out of every 5 queries still appeared as mismatches. In the 1-year sample for topics, large variations (scores that differed by more than one point) occurred slightly more often than exact matches.
- Imputation differences: Google Trends returns low interest scores as "<1" instead of as decimal values, so we replaced these with 0.5. When checking whether the imputation skewed the results, we found that its overall effect is near-negligible. Match counts barely changed, so the choice of how to handle "<1" values didn't meaningfully affect the trends observed in the earlier tables.
At this point, we’ve established that variations in Google Trends scores persist in our datasets despite tolerance and imputation adjustments.
Read more about the two sub-studies above by clicking on the corresponding jump link.
Next, we looked for patterns or commonalities that may have made certain queries align more than others.
- Query-based analysis: Globally recognized people, events, and places appeared most frequently among the highest-matching queries in our dataset. Conversely, queries with the lowest consistency are generally searches that have very low activity in at least one country.
- Location-based analysis: We observed that Japan and India showed the highest alignment in our datasets (with an average of 99 out of 102 queries matching across samples and time ranges). The U.S. pairs didn’t reach the same level of alignment in any single week (averaging 52 out of 102 queries matched). Topic grouping also appeared to introduce more variation across regions (compared to term-based queries), especially when the U.S. was included in the comparison.
From the tests above, we were able to conclude that, per our dataset, the global popularity of a query and the apparent location from which a search was made could influence result variability on Google Trends.
Read more about the two sub-studies above by clicking on the corresponding jump link.
We wanted to make sure that no external factors were affecting our results. So, after the initial tests, we conducted four additional sub-studies.
Our team used 10 queries randomly selected from our original dataset and expanded our locations to include France and the U. K. We wanted to introduce European countries to the dataset and see how results may vary compared to those from Asia and America. Moreover, we chose these two countries specifically so that one is predominantly English-speaking and the other isn’t.
- Hardware and geographic consistency: First, we examined whether device type or VPN server location affected the results. The same queries were run on three devices ("PC1," "PC2," and "Laptop"), with each device connected to VPN servers in the five countries, while all other settings remained the same.
- Result: We observed more exact matches between "PC1" and "PC2," with an average of 9.5 out of 10 possible. The "Laptop" pairs averaged 8.1 out of 10 potential matches. All countries’ scores were consistently high across devices, except for the U.S. (which scored an average of 5.89). Moreover, when comparing results across the five countries, the average matches dropped to 5.5 out of 10.
- Interpretation: The device used had a minor to negligible influence on the results, while geography appeared to be the primary driver of score differences.
- Internal data consistency across devices: To isolate the device type as the primary variable under observation (separate from geographic location), we ran the same queries simultaneously on 3 different devices connected to the same VPN server in the U. K. The process was then repeated using VPN servers in Japan and the U.S.
- Result: We recorded a near-perfect consistency across all devices (correlation of 0.999998+). Nearly all queries (99.4%) matched within 3 points, while 81.9% matched exactly across the 3 devices.
- Interpretation: Trends or scores for a single query and location remain mostly consistent, no matter the device you use.
- VPN impact on a single geographic chart: We tested whether the location from which you conduct a search affected the scores for a specific Google Trends region. Our team set the region to "Japan" instead of "worldwide." The same query was then run three times using VPN servers in Japan, the U. K., and the U.S.
- Result: We observed significant variation compared to the previous test. Around 6 out of 10 queries matched within 3 points, and even fewer (30.5%) matched exactly. Topics (rather than terms) displayed the lowest match percentage (17.8%).
- Interpretation: Your apparent IP location (based on either where you physically are or what VPN server you’re connected to) may affect Google Trends scores even when the selected region is specific and remains unchanged.
- Impact of granularity: We ran the same queries for the same terms and locations using three different timeframes: an hourly view (7-day chart), a daily view (90-day chart), and a weekly view (12-month chart). This allowed us to observe how the same scores may differ depending on the selected timeframe.
- Result: When the 7-day view was compared to the tail end of the 90-day view, the chart aligned for the most part. However, the 90-day view (aggregated into weeks) didn’t generally produce the same patterns as the full 12-month chart.
- Interpretation: The results were as we expected; Google Trends uses different sampling, scaling, and grouping methods depending on the selected time range. So, the scores for every query may vary depending on the range you choose to use to view the same data.
For tests 2 and 3, we tested with only three countries (Japan, the U. K., and the U.S.). This was done to keep the analysis balanced, with only one country per continent.
Read more about the four additional tests above by clicking on the corresponding jump link.
Conclusion: What is the data saying?
Overall, our findings suggest that the reproducibility of online data could be affected by external and internal factors (such as where you search from and the time range you select on Google Trends, respectively). However, this doesn’t mean that any information sourced from online tools is automatically inaccurate or skewed.
The fluctuations we observed in our dataset were relatively small for most queries. While the scores varied from test to test, their perceived popularity was more or less stable. Still, the minor discrepancies are worth noting, especially for researchers, journalists, and everyday users who are looking to get accurate and concrete information.
Most users might expect trend tools to return consistent data for fixed parameters, such as a "worldwide" score for a specific period. And yet, differences in sampling and normalization methods can make a user’s location and time range choices a factor in the results.
Some terms had more varied results across countries than others. For example, the term "MASHA ULTRAFUNK - HISTED" (on one day in the 1-year time range) had a score of 74 when searched from India, 1 when searched from Japan, and 1 when searched from the U.S. Other queries had a discrepancy of ±10 on certain days.
So, to make the most of Google Trends and other online resources, users can run searches and review data across different time periods and locations. A VPN gives you the option to submit queries through different IP addresses, which would generally give you a more varied dataset.
To interpret Google Trends data more carefully, consider the following:
- Determine the query type you’re looking for: Terms tend to have more consistent results, but topics contemplate linguistic variances. Globally recognized queries are also typically more consistent across different locations.
- Opt for longer time windows whenever possible: Between 90 days and 30 days, the former is more likely to provide you with stable results, having smoothed out temporary fluctuations in the shorter window.
- Run your search from different locations: Regardless of your target location (whether a specific region or "worldwide"), the results you get may vary slightly depending on where you are when you conduct the search.
Digital tools play an important role in how information is presented and interpreted online. Understanding how these tools work, including their limitations, can help users interpret trend data more carefully and accurately. Recognizing that results may vary under different conditions can help support more careful analysis and more informed use of online data tools.
Detailed results of the study
Below is an in-depth breakdown of our research and findings.
Higher rate of data variation in the short-term study
Google Trends scores reflect relative daily search interest using a scale of 0–100. Each term (and topic) is assigned a score for a specific period of time and location. We wanted to figure out whether variations in scores were common. So, we observed the weekly "worldwide" scores of our chosen terms and topics over the course of a year.
A match was recorded whenever terms or topics had the same score across the 3 countries in that week; any difference in weekly "worldwide" scores between one or more countries was considered a mismatch.
We analyzed data from two time ranges with the hypothesis that the 1-year study, being more recent, might come with temporary fluctuations. The 5-year study was intended to check whether any variations found in the shorter dataset would be smoothed out and significantly reduced.
Match rates for terms increased when the observation window was expanded from 1 year to 5 years (from 47.0% in the smaller study to 66.9% in the larger one). Across both time periods, topics showed lower match rates than terms.
Even within the 5-year timeframe, mismatches still appeared in a notable share of results. This tells us that the variations observed in the 1-year period weren’t just caused by temporary fluctuations in the data.
Similar relative results from magnitude and tolerance tests
We also acknowledged that 1-point differences may be skewing our findings. So, we performed a more lenient comparison, treating scores within ±1 of each other as matches.
Our team first examined the magnitude of variation in match scores across the three countries to see how much the results differed. We calculated it using the following designations:
- All three matched (0): identical score in the three countries.
- Small variation (≤1): scores differ by no more than one point.
- Large variation (>1): scores differ by more than one point.
In the 1-year sample for terms, 31.7% showed a small variation of one point or less, while 21.3% showed a larger variation of more than one point. In the 5-year sample for terms, small variations accounted for 23.7% of comparisons, while larger variations decreased to 9.5%.
For topics in the 1-year sample, the results were more evenly distributed across the groups. Small-variation mismatches accounted for 32.0% of comparisons, while 35.2% showed larger variation. Unlike with terms, large variations appeared slightly more often than exact matches for topics in the 1-year study.
Our team observed the same patterns despite increasing the tolerance for what can be considered an exact match. While the "absolute" figures changed, we saw the same pattern between the short- and long-term datasets (that is, some inconsistencies were smoothed out in the 5-year sample).
Our team compared two matching rules on the same weekly data:
- Strict match: counted as a match only if the three countries’ scores were exactly identical.
- Matched within 1 point: counted as a match if the three scores differed by no more than one point (strict matches plus small variations).
Applying a 1-point tolerance increased the number of comparisons considered consistent across all groups in our dataset:
- Terms: from 47.0% to 78.7% in the 1-year sample; from 66.9% to 90.6% in the 5-year sample.
- Topics: from 32.8% to 64.8% in the 1-year sample; from 55.4% to 81.0% in the 5-year sample.
Even after applying the tolerance threshold, some comparisons still differed by more than one point.
Overall, longer timeframes in our dataset showed higher alignment and fewer variations. Exact matches became more common in the 5-year sample for both terms and topics. Topics, however, remained less consistent than terms across both timeframes.
Within our sample, the broader subject coverage used for topics didn’t appear to produce more uniform scores across locations.
Confirmed data consistency after imputation review
When you export data from Google Trends, points with very low interest are logged as the string "<1," which represents a value below 1. On the Google Trends chart interface, these same values appear as 0.
In the main study, we treated "<1" values as 0.5, as it is the midpoint between 0 and 1. To examine whether this decision affected the results, we repeated the exact match comparison three times while changing only the way "<1" values were handled:
- "<1" = 0.5: the baseline method used throughout the main study.
- "<1" unchanged: the value remained as the literal string "<1," meaning it only matched another "<1" value and not a number.
- "<1" = 0: the value was treated as 0, matching how Google Trends displays it in the chart view.
Blank cells were treated as 0 in all three scenarios.
The first two imputation methods produced identical match counts across all four groups. Under exact matching, a comparison only counted as a match when all three countries returned the same value. Because of that, replacing "<1" with 0.5 did not change whether the values matched.
The third imputation produced slightly higher match counts. This occurred in cases where one country returned "<1" and another returned a true 0. Treating "<1" as 0 caused those comparisons to count as matches.
Within our dataset, however, the overall effect is near-negligible. In the 1-year sample, the match count changed by only 0.06% for both terms and topics. In the 5-year sample, the match count increased by 0.18% for the terms and 0.16% for the topics.
Overall, the choice of how to handle "<1" values didn't meaningfully affect the trends observed in the earlier tables.
Potential patterns in term and topic consistency
We wanted to see if there was a commonality between terms and topics that matched more or less than other queries. So, for each of the 102 queries, we counted how many weeks the U.S., India, and Japan returned the exact same Google Trends score.
A match means all three countries returned the same weekly score for the same query. The highest possible match count was 52 in the 1-year dataset and 260 in the 5-year dataset.
Globally recognized people, events, and places appeared most frequently among the highest-matching queries in our dataset. The term "Catherine, Princess of Wales" matched in all but one instance across our 1-year and 5-year studies combined. Major sports events such as the FIFA Club World Cup, UEFA European Championship, and ICC Champions Trophy appeared in the top results, too.
We also found that a term having consistent scores didn’t automatically mean that the related topic would be similarly stable. In several cases, terms showed much higher consistency than their related topics.
For example, "Lovely - Billie Eilish" matched in 51 of 52 weeks as a term, while its related topic matched in only 7 of those weeks. "Tokyo Station, Tokyo, Japan" matched in all 260 weeks of the 5-year study, while its related topic matched in only 38 weeks.
In our dataset, queries with the lowest consistency are generally searches that either have very low activity in at least one country (such as "MASHA ULTRAFUNK - HISTED") or those with broad topic labels like "Drink," "Food," "Dog breed," or "Video game."
Query match rates relative to location
Next, we examined whether there was a correlation between the location from which the search was made and the query match rate. So, for each week and each pair of countries, we counted how many of the 102 queries returned the same exact Google Trends score. Each comparison looked at only two countries at a time, and we averaged the weekly counts to get one alignment score for each country pair:
Japan and India matched on about 98 of the 102 terms per week on average. The U.S.–Japan and U.S.–India pairs matched on about 48 terms per week. In this sample, the U.S. pairs didn’t reach the same level of alignment as Japan and India in any single week.
The same pattern was observed across the 5-year dataset, but match counts increased for all three pairs. Japan and India averaged about 100 out of 102 matches per week, meaning they matched on nearly all 102 queries in most weeks. The U.S. pairs increased from about 48 to about 69 matches per week.
As with other subsets of our study, the longer window appeared to have reduced short-term changes, bringing the U.S. pairs slightly closer to Japan–India.
Topic-level alignment followed the same general pattern, but the gap was wider. In the 1-year study, Japan and India matched on about 98 out of 102 topics per week. The U.S.–Japan and U.S.–India pairs matched on about 34 topics per week. This means topic scores differed between the U.S. and each of the two Asian countries for many queries in a typical week.
In the 5-year study, Japan and India again matched on about 100 of 102 topics per week, while the U.S. pairs matched on about 57 topics per week. This was still lower than their term-score results (which were about 69 matches per week) and lower than the Japan–India pair.
Overall, Japan and India showed the highest alignment in this dataset. Their match counts stayed close to the maximum of 102 in both timeframes and for both score types. This means that, for these 102 queries, weekly interest patterns were very similar in the two countries.
Within our dataset, topics were also more varied across regions, especially when the U.S. was included in the comparison.
Additional tests: locations and other external factors
To ensure that external factors like devices used and data batching didn’t significantly influence our results, we conducted 4 additional tests. This time, our team used 10 queries randomly selected from the original 102 and added France and the U. K. to our VPN locations to see whether geographic distance influenced result alignment between countries.
Test 1: Hardware and geographic consistency
To examine hardware consistency and geographic variation, we re-ran the randomly selected 10 queries across three devices: "PC1," "PC2," and "Laptop." Each device was connected to VPN servers in the five countries: France, India, Japan, the U. K., and the U.S. All other settings remained the same.
The study used a 90-day window from January 12, 2026, to April 12, 2026. We collected daily Google Trends scores for each query, device, and country combination.
For each day and country, we counted how many of the 10 queries returned the exact same score across all three devices. The highest possible match count on any given day was 10, meaning all 10 queries returned identical scores across the compared group. We then repeated the process by device, this time checking how many queries matched across all five countries.
The results were then averaged across all 91 days of the study.
The average match counts for France, India, and the U. K. were above 9, suggesting relative consistency. Japan and the U.S. returned lower average match counts, with the U.S. matching only about half the time.
The device-pair alignment results suggest that the difference wasn’t spread evenly across all devices. In the U.S., "PC1" and "PC2" matched on an average of 9.93 queries per day. But both differed from "Laptop," which averaged around 5.10 out of 10. In Japan, the same pattern appeared, but it was less pronounced: "PC1" and "PC2" matched at 8.54, while "PC1" and "Laptop" matched at 6.24.
In our sample, this suggests that the device used didn’t create random changes in the data. Instead, in some locations, one device appeared to receive a different Google Trends sample than the other two. Outside Japan and the U.S., the devices produced similar enough results to be treated as effectively interchangeable in this test.
On most days, only about 2 to 3 out of 10 queries returned the same score across all five countries at the same time. When the device was considered the variable (as shown in the first table), term and topic scores were relatively higher than when the location was the variable (as shown in the second table). This tells us that geographic alignment was much lower than hardware alignment in this sample.
Two country pairs stood out with much higher match rates: India–Japan and France–U. K. Both pairs averaged more than 8 matching queries out of 10 per day. This was similar to the main study, where India and Japan also showed the strongest alignment. These were also the country pairs within the same continent.
Pairs that included the U.S. averaged 5.1 matches out of 10 per day. The U.S. had the lowest alignment with the U. K., the one other country with English as its most widely used language. Meanwhile, those that included one Asian and one European country averaged 4.4 matches.
Overall, differences between countries were much larger than differences between devices in our study. Even with the lower device alignment seen in Japan and the U.S., devices still matched on about 8 out of 10 queries per day on average. Across countries, full agreement averaged only about 2 to 3 out of 10 queries per day.
Test 2: Internal data consistency across devices
To isolate hardware as the only variable, we ran the same query at the same time on three devices connected to the same VPN server in the same country. The test was repeated in Japan, the U. K., and the U.S. We tested with only three countries to keep the analysis balanced, with only one country per continent.
The dataset covered 54 weekly observations for each combination, using a 12-month period from April 2025 to April 2026 across the 10 study queries.
For each country, query, and week, we compared the scores from the three devices. The main metric was the range across devices (i.e., the difference between the highest and lowest scores). In the table below, you can see the percentage of queries that matched across 3 devices ("All three matched").
The test results support the finding of our previous test: that hardware is a minor source of variation in our study. Across 1,620 weekly observations for each score type, the three devices returned the same number in about 82% of cases. More than 99% of observations were within a 3-point range.
Test 3: VPN impact on a single geographic chart
This test fixed the Google Trends region to "Japan" (instead of "worldwide") and changed only the VPN server location. Our team wanted to rule out the possibility that the "worldwide" setting cast too wide a net, which could have led to the variance in results.
We collected weekly query scores through the 12-month time range (April 2025 to April 2026), using VPN servers in Japan, the U. K., and the U.S. Similar to the previous test, we used only three countries to keep the analysis balanced.
For each query and week, we compared the scores returned by the three VPN locations. As in Test 2, the main metric was the range between the highest and lowest values. A range of 0 means all three VPN locations returned the exact same score.
Moreover, we used one value per query, week, and VPN location to reduce the effect of device-level variation. (Test 2 had already shown that the three devices matched in about 82% of observations.)
This was one of the clearer patterns observed in our dataset. The results from this sample suggest that changing the VPN location may affect Google Trends scores even when the selected Google Trends region is specific and remains unchanged.
Test 4: Impact of granularity
For this test, we didn’t look at query matches and instead tested whether charts from different time ranges could line up when stitched together. This was done to assess how often users may expect results to vary across different timeframes (as seen in our 1-year and 5-year samples).
We ran the same queries for the same terms and locations across three timeframes: hourly (7-day view), daily (90-day view), and weekly (12-month view). Our team wanted to see how different time windows may affect reported scores. To be clear, we didn’t compare the accuracy of one timeframe versus another. Rather, we wanted to observe how specific scores may vary depending on the selected timeframe.
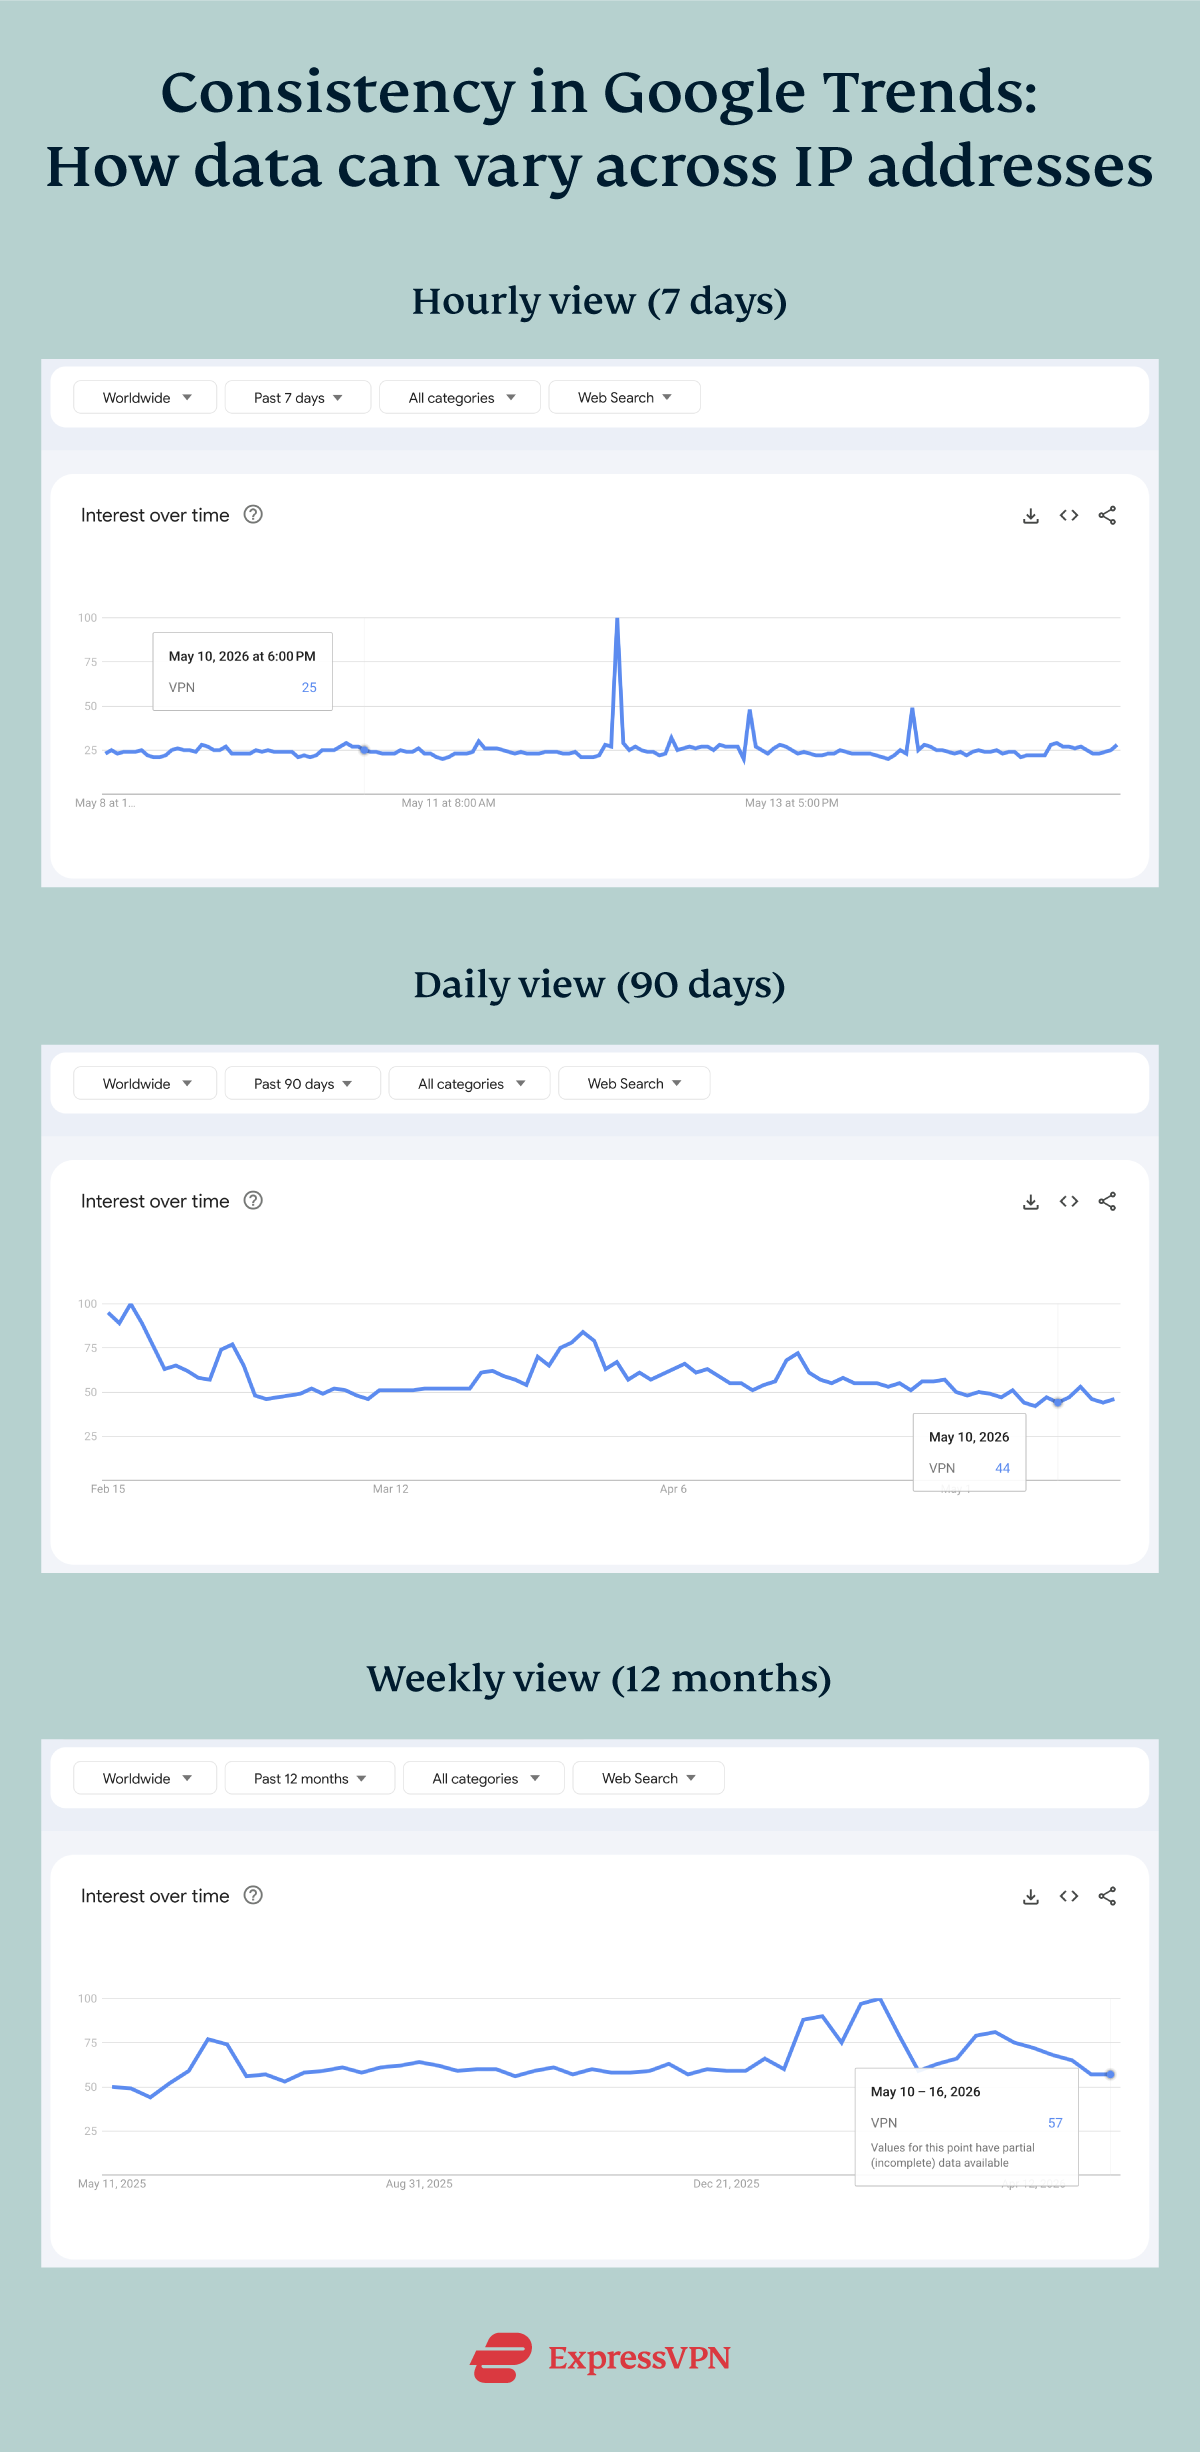
The data appeared consistent within shorter time frames. The hourly chart generally aligned with the daily chart and could be used as a more detailed view of the same pattern. Across longer timeframes, however, the differences became larger.
In our dataset, the aggregated 90-day data didn’t display the same weekly patterns shown in the 12-month chart. That is, weekly values in the 12-month chart didn’t appear to be a direct roll-up of daily values from the 90-day chart. These results suggest that Google Trends may use different sampling, scaling, or grouping methods depending on the selected timeframe.
Based on these findings, researchers may want to avoid mixing timeframes when calculating averages, identifying peaks, or building comparisons.
Appendix
How Google Trends works
Google Trends uses a sample of actual Google search requests rather than the full dataset to provide an anonymized and categorized record of search intent and behavior daily.
Some exclusions to consider:
- It displays only relative, not absolute, interest. This means that two different terms with a score of 100 in a given period may not have the same actual search volume.
- It filters out duplicate searches from the same person in a short time, queries with special characters, and searches from Google products like AI Mode.
Moreover, Google Trends distinguishes between search terms and topics. A term is an exact word or phrase users enter, limited to that spelling and language. A topic, however, covers a broader concept, combining related queries across languages for a more complete view of interest.
For example, the term "UEFA European Championship" would only show interest for that exact combination of words, whereas its corresponding topic ("UEFA European Championship Soccer championship") would aggregate results from a group of terms that share the same concept in any language.
How Google’s Year in Search works
Each Google YiS is unique, with variations in both the categories included and their total count. For instance, 2020 featured 12 categories; however, in 2025, Google used two levels of categories: 6 main categories and 19 subcategories.
Although some categories (like "News") recur annually, others (like "Google Maps: Bookstore") appear only once or twice. We have no way of knowing the criteria Google uses to select the categories it features in its YiS.
The following table shows the complete list of categories that appeared from 2020 to 2025, without duplicates:
From all the terms that appeared on Google’s YiS, we randomly selected 100 that we considered neutral, non-political, and unlikely to trigger censorship or regional filtering. Then we added the industry-related terms "VPN" and "Antivirus," bringing the total to 102.
Full data collection process
All data was collected in CSV format using a Chrome Incognito window that was logged out and connected to an ExpressVPN server in each selected country. Those files were downloaded and combined into weekly and yearly scores for the 1-year and 5-year studies.
Google Trends considers low interest scores as "<1" instead of displaying decimal values, so we replaced these with 0.5. Blank cells were set to 0 to facilitate calculations.
The cleaned datasets were organized by country and period, resulting in a total of 6 standardized sheets. We then used a Python script to merge the CSVs under the following conditions:
- Auto-detects delimiter (comma, semicolon, tab) and handles UTF-8-SIG or CP1252 encodings.
- Reads the header on Row 3 (as exported by Trends) and keeps the first 3 columns, renamed to Week, Term, Topic.
- Adds provenance fields: File name and Search term (captured from the CSV’s second-column header).
- Safely normalizes dates (Week → dd-MMM-YYYY) where parseable; leaves unparseable as-is.
- Preserves raw values as text (e.g., "<1" stays "<1"; blanks stay blank). No numeric coercion, no edits to scores.
- Skips malformed files (e.g., fewer than 3 lines or columns) and writes a single Excel output (Results sheet).
To identify the top and least matched terms, the dataset was filtered to count how many times each term or topic returned weekly Google Trends scores across all three countries. The total number of matches was then calculated for each term over the full study period.
Use our interactive tool below to review and visualize our data:
Limitations and other considerations
While this study may suggest that the reproducibility of online data could be affected by external factors (such as location), our sample and methodology are insufficient to draw this conclusion. Moreover, this research wasn’t designed to determine exactly why those differences occur or how broadly they apply.
Our study represents data and results from three high-usage regions worldwide but doesn’t capture the full global range of possible endpoints. A repeat of this study that includes more regions and countries is highly encouraged to compare results on a broader scale.
Given the continuous updates to Google Trends data, the results also only reflect a snapshot of the data at the time it was gathered. Re-running the same queries at a later date might produce slightly different results, even under identical conditions.
Moreover, the terms and topics covered are diverse and pre-validated against Google’s list of most popular search queries, but the dataset remains finite and insufficient to represent every type of search query or behavior in Google Trends.
Each term also required manual selection of the most relevant "topic" in Google Trends. While this was done consistently across all countries, a small element of human judgment was involved. Misclassification was minimized by cross-verifying selections, but it can’t be fully eliminated.
Finally, this study examines data consistency, not user behavior. Variations are purely numerical and reflect only how Google Trends displays searches through IP addresses from three countries. It doesn’t represent people’s search patterns, preferences, or interests.
For upcoming updates, we recommend choosing terms directly from Google Trends in 10 categories:
- Technology and electronics
- Global sporting events
- International food and drink
- Mass entertainment
- Digital services and platforms
- Automotive and mobility
- Travel and landmarks
- Apparel and fashion
- Gaming and e-sports
- Science and nature
Selecting 10 top-scoring terms per category can minimize bias and enhance reproducibility.