What is traceroute and how to use it for network diagnostics


Traceroute is a useful tool for checking the path your internet traffic takes to reach a specific destination. It helps you spot where delays, bottlenecks, or connection issues might be happening along the way. However, if you’re not familiar with how networks work, the traceroute report can seem full of strange numbers and technical jargon.
That’s why we created this guide: to explain what traceroute is, when and why you’d use it, and how to make sense of the results. By the end, you’ll know how to use traceroute to troubleshoot connection problems and understand what’s really going on with your network.
What is traceroute?
When you send data over the internet, it’s broken into small units called packets that travel independently across the network. Each packet passes through multiple routers, which direct it along the best path toward its destination.
Traceroute is a network diagnostic tool that maps the path data packets take from your device to a destination host. It lists each router (or “hop”) along the route and shows how long it takes for data to reach them. By revealing this path, traceroute helps visualize how your data travels across networks and where issues might occur.
Traceroute gives network professionals and administrators deep visibility into how data moves across interconnected systems. While a ping test simply confirms that a destination is reachable and measures total round-trip time (RTT), traceroute breaks that journey down into individual hops, showing exactly where delays or drops happen. This helps diagnose a range of issues, including:
- Routing misconfigurations that send traffic through inefficient paths.
- Firewall or filtering problems that block or delay packets.
- Network congestion that slows specific hops.
- Asymmetric routing, where traffic takes different paths in each direction.
How traceroute works
Traceroute identifies each router between your device and a destination by manipulating a value in every packet called the time to live (TTL).
Each router that forwards a packet decreases its TTL by one. When the TTL reaches zero, the router discards the packet and replies with an Internet Control Message Protocol (ICMP) Time Exceeded message. Traceroute takes advantage of this behavior by sending packets with gradually increasing TTL values (starting at one) to reveal each hop in sequence.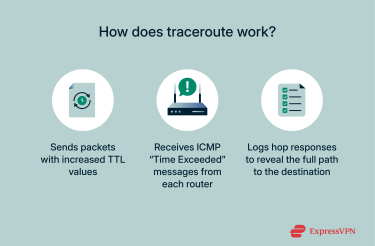
Most traceroute tools send multiple probes per hop to calculate RTTs and provide a more reliable latency measurement. The resulting output lists:
- The hop number (the router’s order in the route)
- The RTTs for each probe
- The router’s IP address or hostname, if resolvable
From these results, you can estimate how far each hop is, identify unusually high latency, and spot unreachable points along the route.
Hops and latency explained
Each hop in a traceroute represents a router or gateway that forwards traffic toward its destination. A typical output line shows three RTT measurements, one for each probe sent. Small variations between them are normal, while larger or inconsistent times may suggest temporary congestion or rate limiting.
A sharp increase in latency that persists across several hops usually points to a bottleneck. However, an isolated spike that drops back to normal at the next hop often just means the router is deprioritizing diagnostic packets rather than slowing real traffic.
ICMP, UDP, and TCP in traceroute
Traceroute’s accuracy depends partly on the transport protocol it uses. Although all versions rely on ICMP Time Exceeded replies, the type of packet sent can vary by operating system:
- Windows traceroute tools use ICMP Echo Request packets, similar to ping.
- Linux and macOS versions typically use User Datagram Protocol (UDP) packets directed at unreachable, high-numbered ports.
- Some modern implementations can also use Transmission Control Protocol (TCP) packets.
Switching protocols can help when certain network devices filter or throttle specific packet types. For example, if ICMP-based traceroute results stop mid-route, running a TCP-based trace may reveal the remaining hops.
Learn more: Read our TCP vs. UDP guide to better understand the key differences and best use cases.
How to run a traceroute
Running traceroute involves launching a command‑line utility and specifying a destination. The process differs slightly across operating systems, but what’s happening is fundamentally the same: collecting the path and latency information by sending probe packets with increasing TTL values.
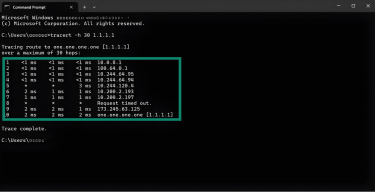
How to run traceroute on Windows
- Open the Command Prompt by searching for it in the Start menu.

- Type tracert followed by the domain name or IP address of the destination and press Enter.
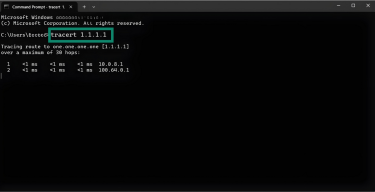
- Include optional switches if needed: /d skips Domain Name System (DNS) lookups, /w sets the timeout in milliseconds, and /4 or /6 forces IPv4 or IPv6.
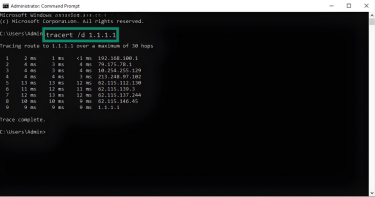
- Observe the output; each line shows a hop’s RTT. Asterisks mean a probe timed out or was blocked.
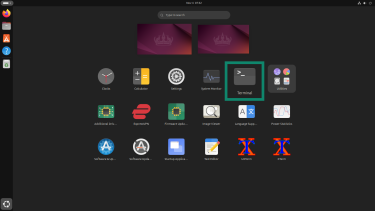
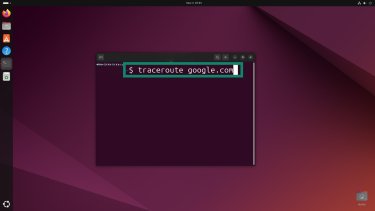
How to run traceroute on Linux
- Open Terminal from your desktop environment or by pressing Ctrl+Alt+T.
- Type traceroute followed by the domain name or IP address of the destination and press Enter.
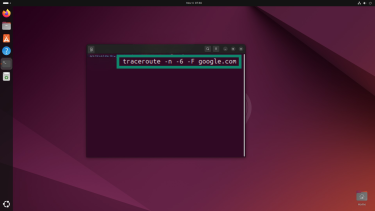
- Use optional flags as needed: -n skips DNS lookups, -6 adds IPv6, and -F forbids fragmentation.
- Review the output; each hop lists the router’s address and RTT.

How to run traceroute on macOS
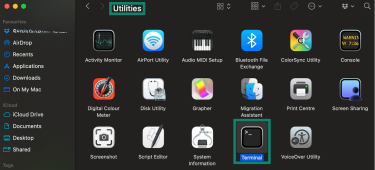
- Launch Terminal from within your Utilities folder.
- Type traceroute followed by the domain name or IP address of the destination and press Return.

- Optionally include the -n flag to skip DNS lookups and display only IP addresses. The -6 flag forces IPv6.

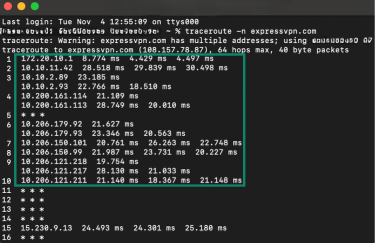
- Wait for traceroute to display each hop and its RTT.
How to run traceroute while using a VPN
- Connect to a VPN, for example, ExpressVPN.
- Run traceroute normally to your chosen destination. Once connected, the VPN server appears as the first visible hop in the route.
- Interpret the results. Latency will typically be higher, as packets now travel through the VPN tunnel before reaching the internet.
How to read traceroute results
Interpreting traceroute output requires understanding how to read the columns and recognizing what different patterns imply. The following sections explain how to make sense of the output, how to interpret latency values, how to spot packet loss, and why results may differ when using a VPN.
Understanding the output format
Traceroute outputs a table. The leftmost column shows the hop number, followed by three time measurements representing the RTT for each probe sent to that hop. For example, a line such as “2, 10 ms, 11 ms, 10 ms 192.0.2.1” means the second hop replied in 10, 11, and 10 milliseconds respectively on the three probes.
The final column lists the router’s hostname and IP address (if DNS resolution is enabled). Running traceroute with -n (Linux/macOS) or /d (Windows) disables hostname lookups and displays only IP addresses.
Here’s an example:
| Hop number | RTT attempt 1 | RTT attempt 2 | RTT attempt 3 | Hop information |
| 1 | 5ms | 6ms | 8ms | 192.168.1.1 |
| 2 | 12ms | 14ms | 15ms | 10.12.0.1 |
| 3 | 15ms | 15ms | 17ms | 172.16.34.22 |
Interpreting latency and round-trip times
When analyzing traceroute results, look for trends rather than isolated spikes. Sustained increases across several hops often point to congestion or misconfigured routing.
Compare RTT patterns over multiple runs to confirm whether high latency is consistent or intermittent. Combined with packet-loss data, these insights help pinpoint where performance degradation begins.
Identifying packet loss and interpreting asterisks in traceroute
When traceroute shows repeated asterisks (*) or “Request timed out” messages, it means some probe packets did not receive replies within the timeout window. This can happen for several reasons:
- Firewalls or access control lists blocking ICMP or UDP traffic
- Routers configured to ignore or deprioritize diagnostic probes
- Overloaded or rate-limited devices unable to respond in time
An isolated asterisk is usually harmless, as many routers suppress ICMP replies to reduce load or for privacy reasons. However, consecutive asterisks across multiple hops or persistent timeouts starting at a particular hop often indicate a more serious issue, such as:
- A blocked or unreachable route
- Firewall rules dropping packets
- Routing failures or “black holes” in the network
Tools like My Traceroute (MTR) combine ping and traceroute functions to calculate packet loss percentages and latency variance, helping confirm whether the issue is transient or ongoing.
Why traceroute results may differ when using a VPN
When traffic is tunneled through a VPN, traceroute can only show the route to the VPN server and its exit point, not the entire underlying path. This is because the VPN encrypts intermediate hops and hides them from view. You may also see different IP addresses due to Network Address Translation (NAT) inside the VPN tunnel.
Latency tends to increase slightly, as packets must travel through and be processed by the VPN server. The delay depends on server location. Nearby servers add just a few milliseconds, while distant ones can add noticeable lag. Well-optimized VPNs like ExpressVPN will minimize the delay.
To troubleshoot VPN connectivity, run traceroute to the VPN server itself rather than expecting a full route to the destination site.
Traceroute vs. other diagnostic tools
Traceroute is a helpful tool, but it’s not the only one used for diagnosing network performance. Other applications complement or improve on traceroute’s capabilities by providing continuous monitoring, measuring various aspects of the network, or overcoming traceroute’s limitations.
Traceroute vs. ping
To understand these tools, it’s important to understand ping. Ping and traceroute are both based on ICMP but serve different purposes. Ping sends continuous ICMP Echo requests to a destination and measures the overall RTT for each reply. It reports if the host is reachable and offers a summary for overall latency and packet loss.
Conversely, traceroute uncovers every hop between your device and the destination and records the RTT for each hop. This granular visibility allows you to pinpoint exactly where delays or packet loss are happening.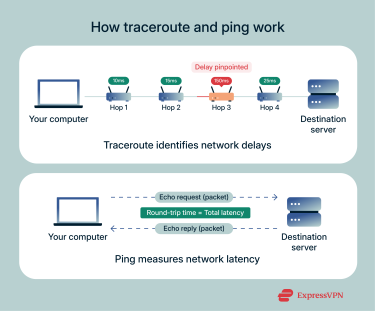
Because ping measures the end‑to‑end experience, it is useful for verifying connectivity and checking your average latency, whereas traceroute is better suited to diagnosing complex routing issues or locating the source of network problems. When used together, ping and traceroute provide both a high‑level and a detailed view of your network performance.
Learn more: Find out how to test your internet speed simply and securely.
Advanced traceroute variants
Over time, several tools have been developed to address limitations in classic traceroute or to provide additional diagnostic benefits.
MTR and its benefits
My Traceroute (MTR) combines traceroute and ping to produce real‑time statistics for each hop. It sends continuous probes while calculating loss percentages, average, best, and worst latency. It also factors in jitter, making it easier to spot intermittent congestion.
MTR is widely available on Linux and also exists as WinMTR for Windows. When using it to investigate issues, let it run long enough to gather meaningful data. You can also share the report with your provider if necessary.
Tracepath overview
Tracepath is a diagnostic tool similar to traceroute but designed to measure the maximum transmission unit (MTU) along the path. It doesn’t usually require elevated privileges and is widely available on Linux.
When you run tracepath destination, it sends probes and records the MTU at each hop, identifying where packets might need to be fragmented. This makes tracepath useful for troubleshooting issues related to packet fragmentation and MTU mismatches.
Tracepath provides less detailed latency information than traceroute. However, traceroute can uncover routing problems that latency-focused tools might miss, and it doesn’t require full root access to use.
Paris traceroute explained
Traditional traceroute can sometimes give misleading results on networks that use load balancing or equal-cost multipath (ECMP) routing. That’s because it changes certain packet details, like the UDP port, for each probe, which can make different probes take slightly different paths.
Paris traceroute solves this problem by keeping all key packet details (source and destination IP addresses, ports, and protocol) the same for every probe. This makes each probe follow the same route, giving a clearer picture of the actual path your data takes.
It works with UDP, TCP, or ICMP packets, and while some routers or NAT devices can still modify headers, Paris traceroute is much more reliable for troubleshooting paths through load-balanced networks. Note that Paris traceroute is primarily a research tool and not always included by default on consumer operating systems; most users won’t have it installed without additional software.
FAQ: Common questions about traceroute
How can I traceroute an IP address or domain?
You can traceroute either an IP address or a domain. Simply replace the destination with an IP or host name in the command. Traceroute resolves host names to IP addresses unless you manually disable Domain Name System (DNS) lookups.
What do the numbers in traceroute mean?
The first number on each line is the hop count. It’s followed by three time values showing the round‑trip time for each probe packet, measured in milliseconds. The final field shows the router’s hostname and IP address, if available. If you see an asterisk, that probe isn’t connecting to the router properly.
Why does traceroute show high latency at certain hops?
High latency at a single hop is usually fine, but it may impact your overall speed. Many routers prioritize forwarding traffic and delay diagnostic replies, so a spike that disappears on the next hop typically indicates low priority for traceroute traffic rather than a real problem. Persistent high latency across several hops points to network congestion.
Does traceroute work when using a VPN?
Yes, traceroute works when you are connected to a VPN, but it shows the path to the VPN server rather than the entire route to the final destination. The VPN creates an encrypted tunnel, so intermediate hops inside the tunnel are hidden. Expect higher round-trip times because your traffic travels to the VPN server first.
Why do traceroute results change with a VPN connection?
Traceroute displays different results while you’re using a VPN, because the VPN encrypts your traffic and routes it through a VPN server. This changes the network path and adds extra hops.
These changes are caused by several factors. Network Address Translation (NAT) inside the VPN may rewrite IP addresses, causing traceroute to report unexpected routes. Additionally, some VPNs respond to time-to-live (TTL)‑expired probes using the wrong interface, which also changes the output.
Is traceroute safe to use while connected to a VPN?
It’s safe to run traceroute while connected to a VPN. Traceroute sends diagnostic probes using Internet Control Message Protocol (ICMP), which doesn’t expose sensitive data. The VPN encrypts your traffic, so the contents of your connection remain private.
Traceroute can’t see inside the VPN's encrypted tunnel; it will show only the route to the VPN server and the exit point. Also, remember that you’ll see increased latency due to the encryption process.
Take the first step to protect yourself online. Try ExpressVPN risk-free.
Get ExpressVPN